Python使用Pandas和Matplotlib按中值对箱形图进行排序
目录
- 引言
- 为什么按中位数对箱形图排序?
- 使用python实现按中值对箱形图排序
- 增强箱形图可视化
- 总结
引言
箱形图是可视化数据分布的强大工具,因为它们提供了对数据集内的散布、四分位数和离群值的洞察。然而,当处理多个组或类别时,通过特定的测量(如中位数)对箱形图进行排序可以提高清晰度并有助于揭示模式。在本文中,我们将探索如何在Python中使用Pandas和Matplotlib按中值对箱形图进行排序。
为什么按中位数对箱形图排序?
箱形图(或盒须图)是一种基于五个关键统计数据显示数据分布的标准化方法:
(最小值,最大值,Q1, Q2, Q3)中心趋势的代表:中位数是一组数据中位于中间位置的数值,它不受极端值的影响,因此是衡量数据集中趋势的一个稳健指标。
抗干扰性:与平均数不同,中位数不受异常值或极端值的影响。在数据集中存在异常值android时,中位数提供了一个更准确的中心位置的度量。
易于比较:当多个箱形图并排放置时,通过中位数对它们进行排序可以直观地比较不同组或类别之间的中心趋势。
视觉清晰:按中位数排序的箱形图可以更清晰地展示数据的分布情况,特别是当数据集之间的中位数差异较大时。
便于识别模式:排序后的箱形图可以帮助观察者识别数据中的模式或趋势,比如哪些组的中位数更高或更低,以及数据的分散程度。
减少混淆:如果不按中位数排序,箱形图可能会显得杂乱无章,特别是当有很多箱形图需要比较时,按中位数排序有助于减少视觉上的混淆。
便于解读:对于不熟悉统计数据的观察者来说,按中位数排序的箱形图更容易解读,因为它们直观地展示了数据的中心位置和分布。
使用Python实现按中值对箱形图排序
首先,确保安装了所需的库:pandas、matplotlib和seaborn。
您可以使用以下命令安装它们:
pip install pandas matplotlib http://www.devze.comseaborn
安装后,导入必要的库:
import pandas as pdhttp://www.devze.com
import matplotlib.pyplot as plt
import seaborn as sns
让我们创建一个样本数据集,在其中我们将为不同的类别生成随机数据:
# Creating a sample Dahttp://www.devze.comtaFrame
data = {
    'Category': ['A', 'B', 'C', 'D', 'E'] * 10,
    'Values': [10, 20, 15, 30, 25, 11, 18, 13, 35, 22, 9, 21, 14, 31, 23,
               12, 19, 16, 28, 24, 8, 17, 14, 29, 26]
}
df = pd.DataFrame(data)
在这个数据集中,我们有一个表示不同类别的Category列和一个表示每个类别的数值的Values列。
步骤1:计算每个类别的中位数
对箱形图进行排序的第一步是计算每个类别的中值。我们将使用Pandas的groupby方法按类别对数据进行分组,并计算每组的中位数:
# Compute the median for each category
category_median = df.groupby('Category')['Values'].median().reset_index()

# Sort the categories by the median
category_median_sorted = category_median.sort_values(by='Values')
这将为我们提供一个基于中值的分类DataFrame。
步骤2:按中位数对类别排序
为了以所需的顺序可视化箱形图,我们需要根据排序的中值对原始DataFrame中的类别进行重新排序。我们可以通过将Category列转换为分类类型并根据排序的中位数指定顺序来实现这一点:
# Reorder the categories in the DataFrame based on the sorted median
df['Category'] = pd.Categorical(df['Category'],
                                categories=category_median_sorted['Category'],
                                ordered=True)
此步骤可确保箱形图类别在绘制时遵循中位数的顺序。
步骤3:创建排序箱形图
现在我们已经将类别按中值排序,我们可以使用seaborn创建箱形图:
# Create the boxplot sorted by median
plt.figure(figsize=(8, 6))
sns.boxplot(x='Category', y='Values', data=df)
plt.title('Boxplot Sorted by Median Values')
plt.show()

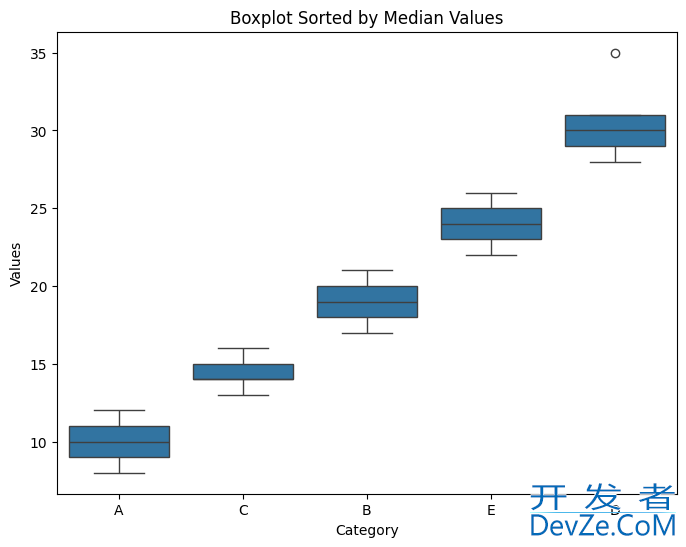
在生成的箱形图中:
- 这些框根据每个类别中数据的中值进行排序。
- 每个框的中位数由框内的线表示。
- 四分位距(IQR)由方框本身表示,而须线表示IQR的1.5倍内的数据范围。
完整代码示例
按中值对类别进行排序有助于更清楚地了解数据分布,并允许更好地比较类别之间的差异。
import pandas as pd
import matplotlib.pyplot as plt
import seaborn as sns
# Sample DataFrame
data = {
    'Category': ['A', 'B', 'C', 'D', 'E'] * 5, # Changed from * 10 to * 5 to match the length of 'Values'
    'Values': [10, 20, 15, 30, 25, 11, 18, 13, 35, 22, 9, 21, 14, 31, 23,
               12, 19, 16, 28, 24, 8, 17, 14, 29, 26]
}
df = pd.DataFrame(data)

# Compute the median for each category and sort by the median
category_median = df.groupby('Category')['Values'].median().reset_index()
category_median_sorted = category_median.sort_values(by='Values')

# Reorder the categories in the DataFrame based on the sorted median
df['Category'] = pd.Categorical(df['Cateandroidgory'],
                                categories=category_median_sorted['Category'],
                                ordered=True)

# Create the boxplot sorted by median
plt.figure(figsize=(8, 6))
sns.boxplot(x='Category', y='Values', data=df)
plt.title('Boxplot Sorted by Median Values')
plt.show()
增强箱形图可视化
1. 突出显示中值
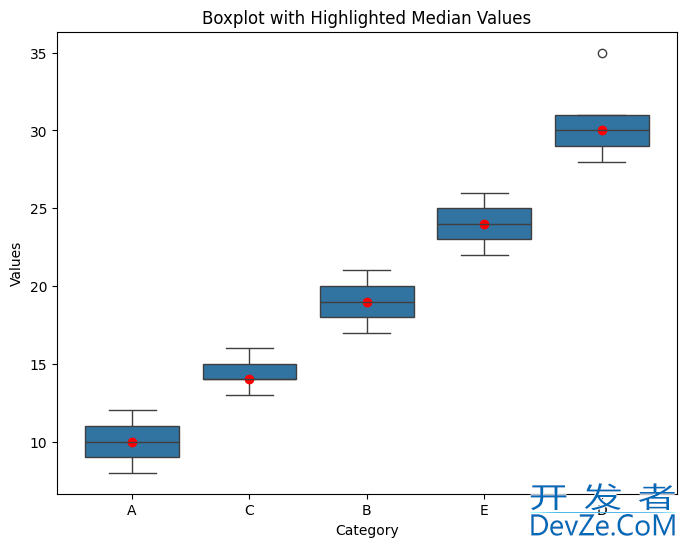
突出显示箱形图上的中值可用于强调排序标准。这可以通过将中值绘制为箱形图上的点来完成:
# Plot the median values as red dots
medians = df.groupby('Category')['Values'].median()
for i in range(len(medians)):
    plt.plot(i, medians[i], 'ro')  # 'ro' is red color with circle marker

plt.title('Boxplot with Highlighted Median Values')
plt.show()

2. 处理中值中的关系
在某些情况下,多个类别可能具有相同的中值。默认情况下,sort_values()按照它们在数据集中出现的顺序排列它们。但是,您可以通过添加其他排序条件来自定义平局打破规则,例如中位数相同时按均值排序:
# Compute both median and mean to handle ties
category_stats = df.groupby('Category').agg({'Values': ['median', 'mean']}).reset_index()
category_stats.columns = ['Category', 'Median', 'Mean']

# Sort by median and then by mean in case of ties
category_stats_sorted = category_stats.sort_values(by=['Median', 'Mean'])
print(category_stats.columns)
输出
Index(['Category', 'Median', 'Mean'], dtype='object')
总结
在Pandas中按中值对箱形图进行排序可以增强可视化的清晰度和可解释性,特别是在处理多个类别时。通过遵循本文中概述的步骤,您可以轻松地计算中位数,重新排序类别,并使用Pandas和Seaborn创建排序箱形图。
以上就是Python使用Pandas和Matplotlib按中值对箱形图进行排序的详细内容,更多关于Python Pandas和Matplotlib箱形图排序的资料请关注编程客栈(www.devze.com)其它相关文章!


 加载中,请稍侯......
精彩评论