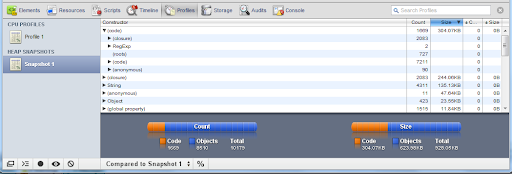
Javascript profiler shows each() spending a lot of time, but how to find where it is?
IE 8 and Firebug's Javascript profiler both showed that jQuery each() spent a lot of time, but since the each() is not inside a function, there is no way to tell which line it is, and there are lots of these each() in the global scope of the source code. On Firebug, it can show you the file and line number, but it will take you to jQuery source code of each(开发者_如何学编程) without any call stack, so it is no use.
Is there a way to find out which each() it was?
Google Chrome's Javascript console lets you take a snapshot of the stack under the "Profiling" tab.
The Scripts tab allows you to step through your scripts line by line.

 加载中,请稍侯......
精彩评论