Python使用Plotly制作交互式图表的操作指南
目录
- 引言
- 核心概念
- 1. 图表部件编程(updatemenus/sliders)
- 2. WebGL加速的大数据渲染
- 3. Dash回调链设计模式
- 4. 图表主题与模板系统
- 实战案例
- 1. 实时疫情数据仪表盘开发
- 2. 3D体素可视化与机器学习特征空间展示
- 扩展思考
- 1. Plotly与Three.js的深度集成
- 2. 图表交互行为的A/B测试设计
引言
Plotly是一款用来做数据分析和可视化的在线平台,功能真的是非常强大,它主要有以下特点:
- 图形多样化:在线绘制多种图形,比如柱状图、饼android图、直方图、饼图、气泡图、桑基图、股票图、旭日图、联合分布图、地图等
- 在线可编辑:Plotly中有在线编辑的平台,可以将生成的图形保存到该平台,并进行分享
- 开源免费:Plotly的所有资源都是开源免费的,用户可直接使用,还可以直接和R、python、MATLAB等软件或者语言无缝对接
- 图形动态化:Plotly生成的图形全部是动态化;Plotly的绘图最好在Jupyter notebook中进行,能够很好地显示动态效果
- 颜色绚丽:在使用Plotly绘制图形的时候,我们可以进行图形颜色的设置,Plotly提供了丰富的颜色面板供选择
- 代码量少:Plotly绘图,尤其是Plotly的高级封装Plotly_Express,代码量非常少;一行代码就能实现多种功能且精美的图形
- 内置丰富数据集:在Plotly中内置7个不同类型的数据集,方便读者直接使用内置数据进行学习、使用
- 文档健全:Plotly官方提供了丰富的文档资料和案例可免费学习,能够快速的上手
- 附录:在官网中展示了Plotly能够绘制的部分图形:https://plotly.com/python/
本文将以Plotly为主介绍python中制作交互式图表的典型用法和高级技巧。
核心概念
1. 图表部件编程(updatemenus/sliders)
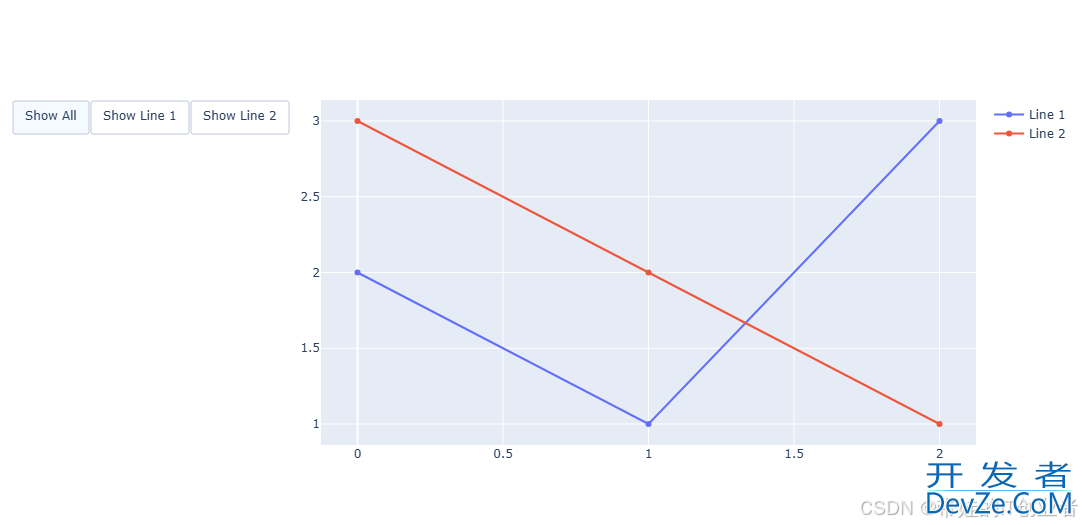
通过 updatemenus 和 sliders 实现动态交互功能,例如切换数据视图或调整参数。
import plotly.graph_objects as go

fig = go.Figure()

# 添加多条折线
fig.add_trace(go.Scatter(y=[2, 1, 3], name="Line 1"))
fig.add_trace(go.Scatter(y=[3, 2, 1], name="Line 2"))

# 配置 updatemenus
fig.update_layout(
    updatemenus=[
        dict(
            type="buttons",
            direction="right",
            buttons=[
                dict(label="Show All", method="update", args=[{"visible": [True, True]}]),
                dict(label="Show Line 1", method="update", args=[{"visible": [True, False]}]),
                dict(label="Show Line 2", method="update", args=[{"visible": [False, True]}]),
            ],
        )
    ]
)

fig.show()
效果:按钮组允许用户切换显示不同的折线。
2. WebGL加速的大数据渲染
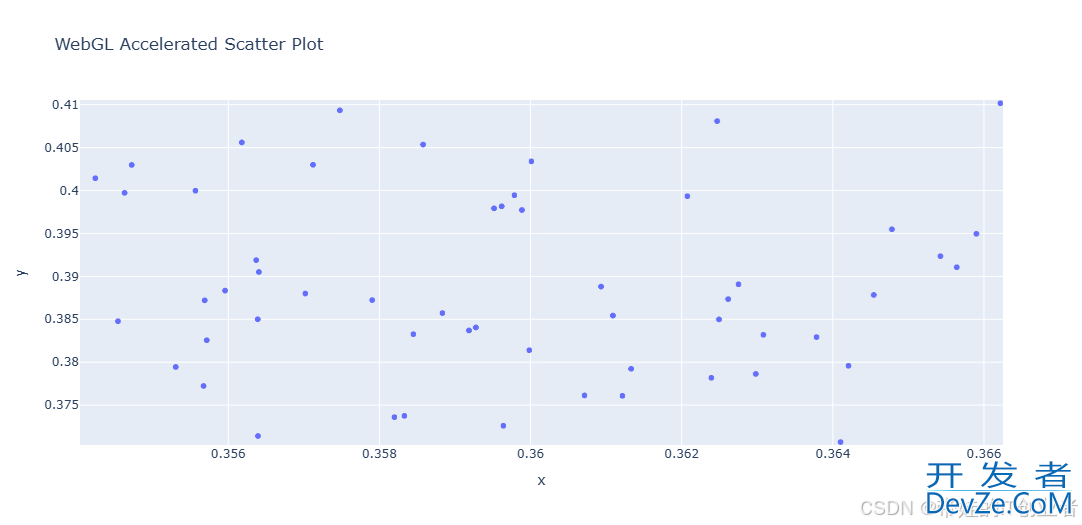
Plotly 支持 WebGL 渲染,适合处理大规模数据集。
import plotly.express as px
import numpy as np

# 模拟大数据
np.random.seed(42)
x = np.random.rand(100_000)
y = np.random.rand(100_000)

# 使用 WebGL 加速的散点图
fig = px.scatter(x=x, y=y, render_mode='webgl', title="Python使用Plotly制作交互式图表的操作指南")
fig.show()
效果:即使数据量达到 10 万点,图表依然流畅。
3. Dash回调链设计模式
Dash 是 Plotly 的框架,用于构建交互式仪表盘。通过回调链实现复杂交互逻辑。
from dash import Dash, dcc, html, Input, Output

app = Dash(__name__)

app.layout = html.Div([
    dcc.Input(id="input编程", value="Hello Plotly!", type="text"),
    html.Div(id="output")
])

@app.callback(Output("output", "children"), [Input("input", "value")])
def update_output(value):
    return f"You entered: {value}"

if __name__ == "__main__":
    app.run_server(debug=True)
效果:输入框内容实时更新到输出区域。
4. 图表主题与模板系统
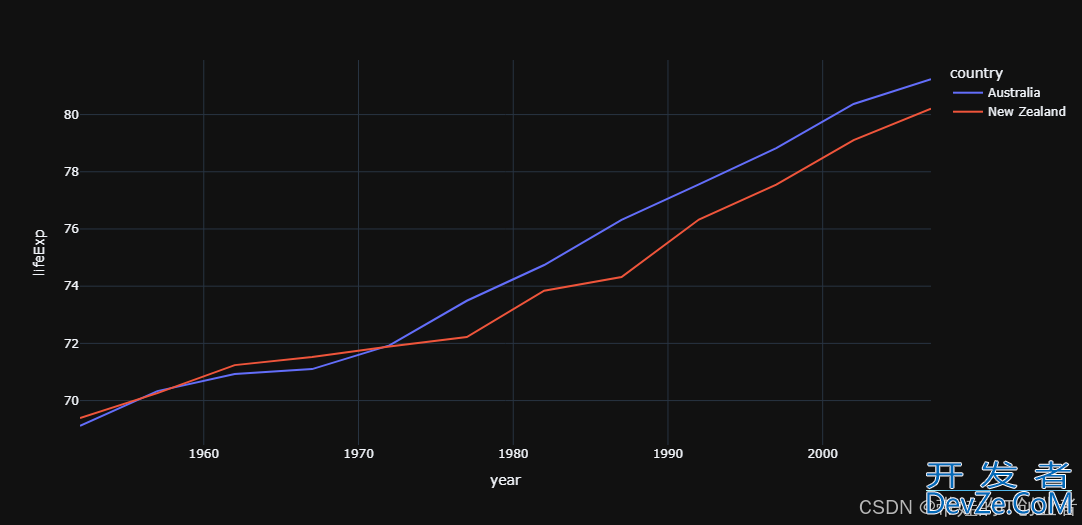
Plotly 提供丰富的主题和模板,可快速javascript定制图表风格。
import plotly.express as px

df = px.data.gapminder().query("continent=='Oceania'")
fig = px.line(df, x="year", y="lifeExp", color="country", template="plotly_dark")
fig.show()
效果:深色主题的折线图,适合夜间模式。
实战案例
1. 实时疫情数据仪表盘开发
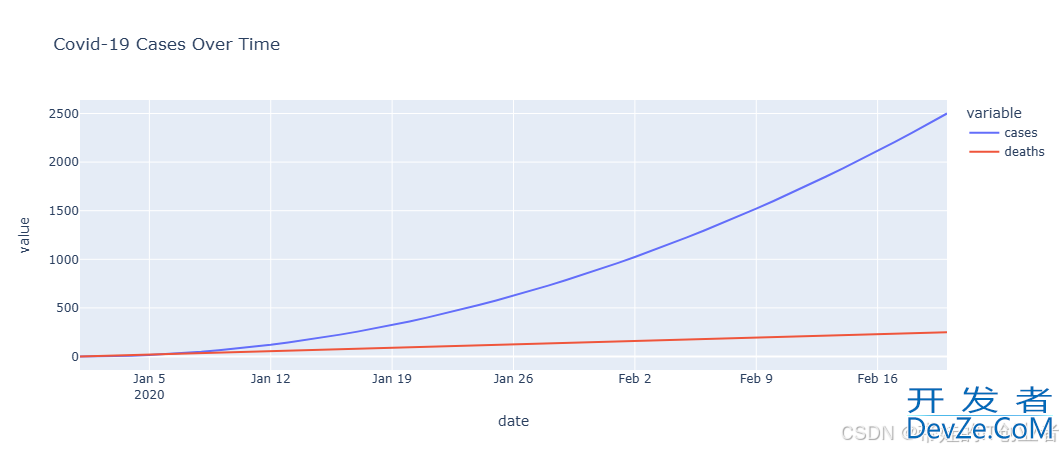
结合 Dash 和 Plotly 构建实时疫情数据仪表盘。
from dash import Dash, dcc, html, Input, Output
import plotly.express as px
import pandsAATiRas as pd

# 模拟疫情数据
data = {
    "date": pd.date_range(start="2020-01-01", periods=100),
    "cases": [i**2 for i in range(100)],
    "deaths": [i * 5 for i in range(100)]
}
df = pd.DataFrame(data)

app = Dash(__name__)

app.layout = html.Div([
    dcc.Graph(id="graph"),
    dcc.Slider(
        id="year-slider",
        min=0,
        max=len(df) - 1,
        value=0,
        marks={i: str(df["date"][i].date()) for i in range(0, len(df), 10)},
        step=None
    )
])

@app.callback(Output("graph", "figure"), [Input("year-slider", "value")])
def update_graph(selected_index):
    filtered_df = df.iloc[:selected_index + 1]
    fig = px.line(filtered_df, x="date", y=["cases", "deaths"], title="Python使用Plotly制作交互式图表的操作指南")
    return fig

if __name__ == "__main__":
    app.run_server(debug=True)
效果:滑块控制时间轴,动态展示疫情数据变化。
2. 3D体素可视化与机器学习特征空间展示
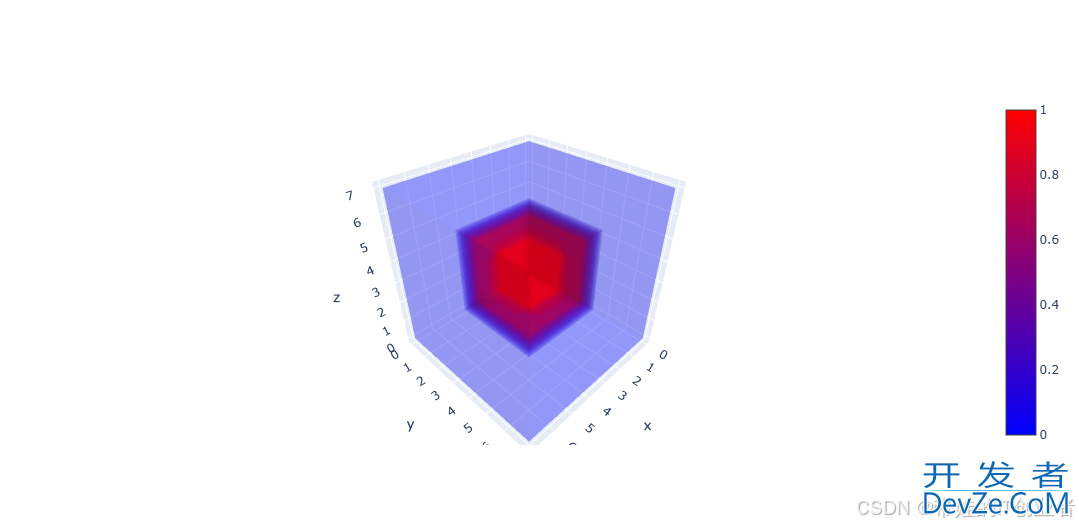
使用 Plotly 绘制 3D 体素图,展示机器学习特征空间。
import plotly.graph_objects as go
import numpy as np

# 创建 3D 体素数据
x, y, z = np.indices((8, 8, 8))
cube1 = (x < 3) & (y < 3) & (z < 3)
cube2 = (x >= 5) & (y >= 5) & (z >= 5)
voxelarray = cube1 | cube2

colors = np.empty(voxelarray.shape, dtype=object)
colors[cube1] = 'blue'
colors[cube2] = 'red'

# 绘制 3D 体素图
fig = go.Figure(data=go.Volume(
    x=x.flatten(),
    y=y.flatten(),
    z=z.flatten(),
    value=voxelarray.flatten(),
    colorscale=["blue", "red"],
    opacity=0.2,
    surface_count=17
))

fig.show()
效果:3D 空间中两个立方体的体素可视化。
扩展思考
1. Plotly与Three.js的深度集成
Plotly 的底层基于 WebGL,可以与 Three.js 深度集成,用于更复杂的 3D 可视化场景。
// 示例:Three.js 与 Plotly 结合的伪代码
// 在 Three.js 场景中嵌入 Plotly 图表
2. 图表交互行为的A/B测试设计
通过 A/B 测试优化图表交互行为,提升用户体验。
# 示例:记录用户点击行为
from dash import Dash, dcc, html
import dash_bootstrap_components as dbc

app = Dash(__name__, external_stylesheets=[dbc.themes.BOOTSTRAP])

app.layout = html.Div([
    dcc.Graph(id="graph", figure=px.bar(x=[1, 2, 3], y=[3, 2, 1])),
    html.Button("Option A", id="button-a"),
    html.Button("Option B", id="button-b"),
    html.Div(id="output")
])

@app.callback(Output("output", "children"), [Input("button-a", "n_clicks"), Input("button-b", "n_clicks")])
def update_output(clicks_a,android clicks_b):
    return f"Option A clicks: {clicks_a or 0}, Option B clicks: {clicks_b or 0}"

if __name__ == "__main__":
    app.run_server(debug=True)
效果:记录用户对不同选项的偏好。
通过掌握这些核心概念和实战案例,您将能够创建出功能强大、交互性强的数据可视化作品。
以上就是Python使用Plotly制作交互式图表的操作指南的详细内容,更多关于Python Plotly交互式图表的资料请关注编程客栈(www.devze.com)其它相关文章!


 加载中,请稍侯......
精彩评论