How to get the survival objects being created by the ctree?
I would like to get the survival objects which are created by the ctree function开发者_开发问答. The reason is that I would like to get the vectors which describe the curves in each leaf of the tree.
Does anyone know how to do that?
Thanks in advance! Alley
You can get at the curves using the treeresponse method. There might be a much better way, but this is what I came up with.
Here is an illustration using the example of a survival tree from ?ctree:
require(party)
data("GBSG2", package = "ipred")
GBSG2ct <- ctree(Surv(time, cens) ~ .,data = GBSG2)
plot(GBSG2ct)
We grab the (fitted) responses, using treeresponse for the training data. This is a list, with a component for each observation in the training data.
out <- treeresponse(GBSG2ct)
Each component out out is a survival object, class "survfit"
> class(out[[1]])
[1] "survfit"
For this tree we have four terminal nodes, so there are only four unique survival objects. You can use the where method to see which nodes the observations were in
wnode <- where(GBSG2ct)
We can use this index the unique survival objects. For example, for node 3 (the leftmost node in the plot of the tree)
> n3 <- which(wnode == 3 & !duplicated(wnode))
> n3
[1] 1
> out[[n3]]
> out[[n3]]
records   n.max n.start  events  median 0.95LCL 0.95UCL
    686     248     248      88    2093    1814      NA
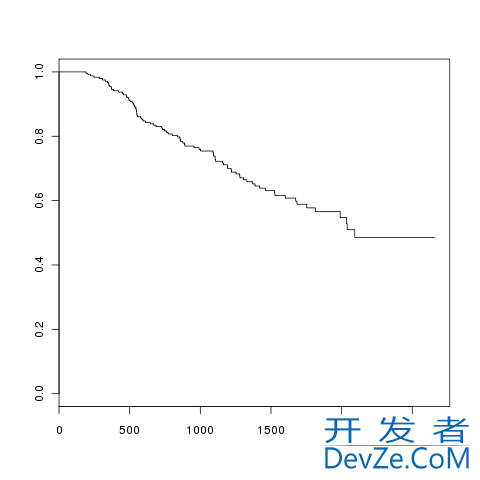
The survival curve for node 3 can be plotted using the plot method:
plot(out[[n3]], conf.int = FALSE, mark.time = FALSE)

which, apart from the range on the axes is the plot used in the panel for node 3 on the tree drawn earlier.
For this example, you can repeat for nodes 4, 6 and 7, but you'll need to tailor which nodes you work with to your data and fitted tree.
 加载中,请稍侯......
精彩评论