Draw hyperplane in R?
How does one go about drawing an hyperplane开发者_运维技巧 (given the equation) in 3D in R ? (i.e. 3d equivalent to "abline")
Thanks in advance,
You probably want the packages scatterplot3d or HH (function regr2.plot). See, e.g., this example for scatterplot3d.
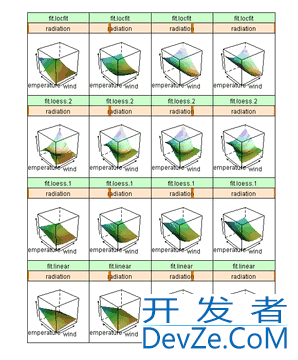
Lattice supports 3D charts. See some of the nice examples from Lattice: Multivariate Data Visualization with R on the LearnR blog. For instance, with wireframe():
pl <- wireframe(fit.linear + fit.loess.1 + fit.loess.2 +
+     fit.locfit ~ wind * temperature | radiation, grid,
+     outer = TRUE, shade = TRUE, zlab = "")

 加载中,请稍侯......
精彩评论