Identifying local minima in a histogram
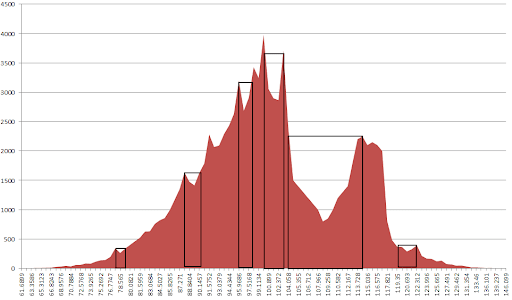
I'm interested in finding the local minima in a histogram that roughly resembles

I'd want to find the local minimum at 109.258, and the easiest way to do so would be to identify whether the number of counts at 109.258 is lower than the average number of counts around in some interval around (and including 109.258). It's identifying this interval that's the most difficult part for me.
As for the source of this data, it's a histogram with 100 bins of non-uniform width. Each bin has a value (shown on the x-axis), and a count of the samples falling into that bin (shown on the y-axis). What I'm trying to do is find the "best" place to split the histogram. Each side of the split is propagated down a binary tree, as part of a classification algorithm.
I'm thinking that my best course of action would be to try to fit a curve to this histogram, using something like the Levenberg-Marquardt algorithm and then to compare the local minima to find the "best" one. A proper measure of "best" would include some indication of the significance of that split, which is measured as the difference between the average counts in the interval to the left and the average of the counts in the interval to the right, and then maybe weight each difference w开发者_运维百科ith the number of counts included to get a composite measurement of "best," if that makes sense.
Either way, computational complexity of the algorithm isn't a huge issue, 100 bins is about the maximum number I'd expect to encounter. However, this calculation will be performed once for each sample, so keeping it linear with respect to the number of bins would, of course, be ideal.
By the way, I'm doing everything in C++, and make use of the boost libraries and STL, so nothing is off-limits in that regard.
Any thoughts or insights concerning best practices would be greatly appreciated!
If I understand correctly kmore wants to partition two "peaks" based on the largest separation (product of histogram count and bin distance). If this is true:
- Find all maxs.
- for each max build rectangles like in Fig.
- Find rectangle with max white area, which gives you the x range to find desirable bin 109.258
Levenberg–Marquardt is not so good a choice in a rugged optimization terrain -- and yours is pretty rugged. There are lots of local minima there. Levenberg–Marquardt might well find the local minimum at about 100. Or it might find one the two global minima at the extremes of the graph where the function tails off to zero.
You want something that finds the most significant local minimum. For example, some kind of clustering algorithm. Here is a very simple one:
Step 1: Find the local extrema in your data set. These are the extrema at the extremes of the range plus the internal local minima and maxima. With your histogram you should have an odd number of such extrema, alternating between minima and maxima.
Step 2: Find the pair with the smallest delta. This will either be a (local max, local min) or a (local min, local max) pair.
Step 3: Find a pair of elements to remove, one of
- The pair found by step 2
- The pair comprising the first element of the pair from step 2 and its predecessor
- The pair comprising the last element of the pair from step 2 and its successor
When the found pair includes a boundary point you should use option 2 or 3, as appropriate. For an internal pair, you might want to use some heuristics in choosing between the three choices. Or you could just do the simple thing and use the found pair.
Step 4: Delete the pair of elements from step 3, keeping track of the deleted pair.
Step 5: Repeat steps 2 to 4 until there are only three elements left in the extrema data set (the extremes of the range plus a local max, hopefully the global max).
The last-removed minima is what you want.
There are lots of other clustering algorithms. The one I presented is rather crude and obviously isn't particularly fast. One that extends nicely to a lot more data, and higher dimensional data is the Expectation Maximization algorithm. Simulated annealing (Metropolis-Hastings) could also be adapted to this problem.
The problem can, of course be transformed into one of peak finding by functional manipulation of the data (inversion or negation are obvious candidates).
Alternatively, if the example is typical, one might begin with peak-finding in the untransformed data and seek regions where the peaks are (relatively) widely separated as candidates for containing a good local minima.
I am forever recommending the method used by the ROOT TSpectrum classes for peak finding.
The underling algorithm is discussed in detail in
- M.Morhac et al.: Background elimination methods for multidimensional coincidence gamma-ray spectra. Nuclear Instruments and Methods in Physics Research A 401 (1997) 113-132.
- M.Morhac et al.: Efficient one- and two-dimensional Gold deconvolution and its application to gamma-ray spectra decomposition. Nuclear Instruments and Methods in Physics Research A 401 (1997) 385-408.
- M.Morhac et al.: Identification of peaks in multidimensional coincidence gamma-ray spectra. Nuclear Instruments and Methods in Research Physics A 443(2000), 108-125.
Copies of these papers are maintained on the ROOT web site and linked in the TSpectrum documentation for those that do not have a subscription to NIM A.
What you want seems to be more complicated than just a local minimum. Also, the local minimum concept depends strongly on your choice of bins.
Have you heard about Otsu's method? It might be more along the lines of what you want.
Here's another Otsu's method link.
 加载中,请稍侯......
精彩评论