Distance between edges and nodes in graphviz
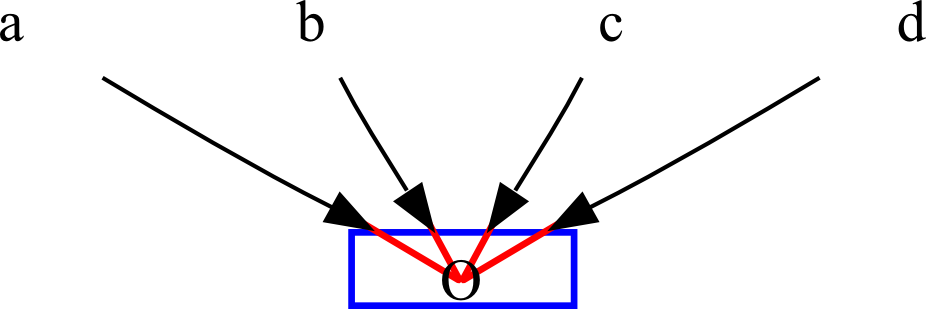
How do I configure the distance between edges开发者_如何学Python and nodes (red), i.e. the outer shape of a node(blue)?

Here is a technique that you can consider that avoids the need to create a custom node shape. There may be some matters of taste that you may need to address further in order to get exactly what you want.
The advantage of this technique, using HTML-like labels, is that varying the space inside and outside the rectangle becomes a simple matter of changing the inner number of points (here 4) and outer number of points (here 16) respectively.
digraph {

node [shape=none]

O [label=<
<TABLE BORDER="0" CELLBORDER="1" CELLSPACING="16" CELLPADDING="4">
<TR><TD WIDTH="70">\N</TD></TR>
</TABLE>
>]

{a,b,c,d} -> O

}
Result:

You can change the BORDER and CELLBORDER parameters to show or hide the rectangles. You can adjust their thicknesses although only in multiples of 1 point. I have used the WIDTH parameter to force a width-to-height ratio that causes the aligning of all the arrow tips. Otherwise some of the tips would meet the sides of the invisible outer rectangle.
Like the other answer said, this isn't really an easy feat. Using a combination of height, width, fixedsize, labelloc, and margin node parameters, you can probably get any desired effect you'd like. Margin is best is you're looking to expand that distance, but to minimize it you need to use the other params. For example, this graph would have the arrowheads almost touching the 'O' node's text.
digraph {
  node [shape="none" width=.2 height=.2 fixedsize="true" labelloc="top"];

  a -> O;
  b -> O;
  c -> O;
  d -> O;
}

Alternatively, if you really want to put in effort, you could create a custom node shape, and do whatever you'd like to it.
This is not possible AFAIK.
The only option available is using headclip to have the edge go to the center of the node or to the edge of the outer shape (as you did in your example).
You may try to add some padding to a node by putting it in a cluster and have the edges clip at the (invisible) border of the cluster:
digraph {
  compound=true;
  subgraph cluster1 {
        style=invis;
        2;
    }
    1 -> 2[lhead=cluster1];
}

Hopefully somebody knows a better hack for this...
 加载中,请稍侯......
精彩评论